Agreement Score & Conflict Detection
Understand how much your team agrees on each idea and spot polarizing topics at a glance.
Got a workshop coming up? Bring it to a 30-min facilitator demo → and we’ll set it up together.
Overview
When participants in IdeaClouds rate ideas, especially with multi-criteria evaluations, their individual scores are combined into a group ranking using a ranking technique like average, median, least misery, or most pleasure. The result is a single computed score per idea.
But that score alone doesn’t tell the full story. A 2.5 out of 4 could mean everyone agrees on a moderate score, or it could mean that half the room loves the idea and the other half rejects it. Agreement Score and Conflict Detection close this gap. Available on the Session Results page, they reveal how aligned your team actually is behind each ranking, so you can trust the results or know exactly where to dig deeper.
What is the Agreement Score?
After participants rate ideas in a session, you see a computed score for each idea. But a score of 2.5 out of 4 could mean very different things:
- Everyone gave a 2 or 3: genuine consensus
- Half gave 0 and the other half gave 4: complete disagreement
The Agreement Score tells you how much the raters agree with each other on a specific rating criterion. It is shown as a percentage from 0% to 100%, where 100% means perfect agreement and 0% means maximum disagreement.
Where to find it on the Session Results page?
On the Session Results page, each evaluated idea shows a star icon with a score. The top-ranked cards also show an agreement badge. Hover over the score to see the detailed tooltip.
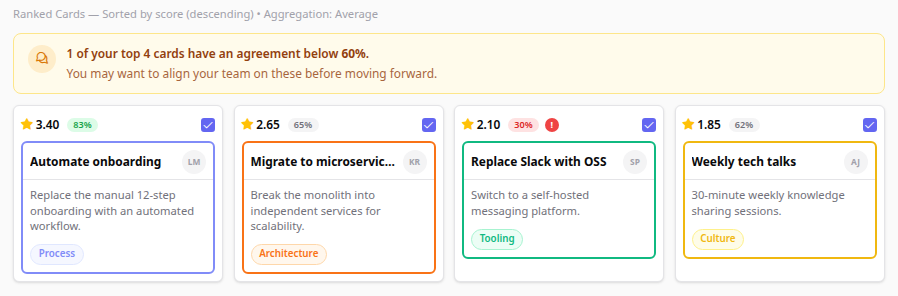
• The agreement badge (e.g. 83%) appears on the top-ranked cards, showing the minimum agreement across all criteria. Cards below the top 5 don't show it.
• The red ! icon signals Conflict Detection: raters have split into opposing camps. Hover it: "High friction potential."
• The warning banner at the top alerts you when some of your top cards have low agreement (<60%).
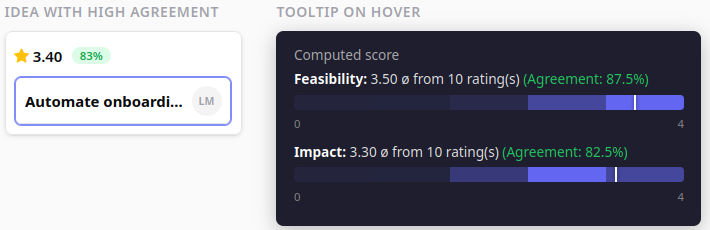
Reading the rating tooltip
Hover over any idea’s score to see the full rating breakdown. Here’s what you’ll find, illustrated with 10 participants and two criteria.
The heatmap shows how votes are distributed across the scale (0–4). Darker = more votes. The white marker line shows the aggregated score position.
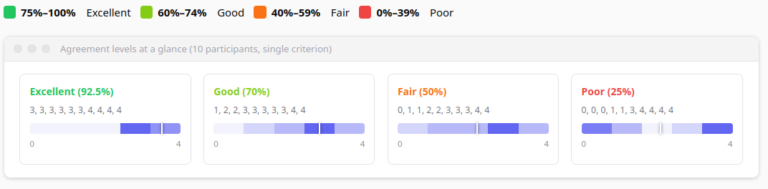
Agreement Score color coding
The agreement score requires at least 2 raters per criterion. With only 1 rater, no agreement is shown.
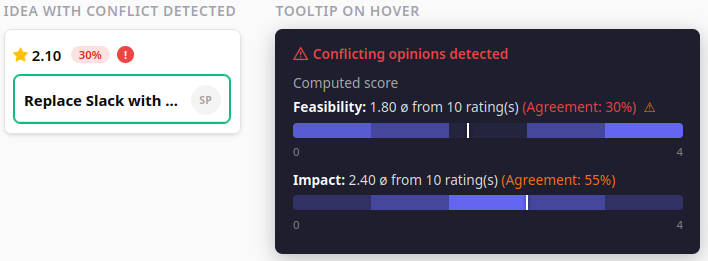
Conflict Detection (Divided Opinions)
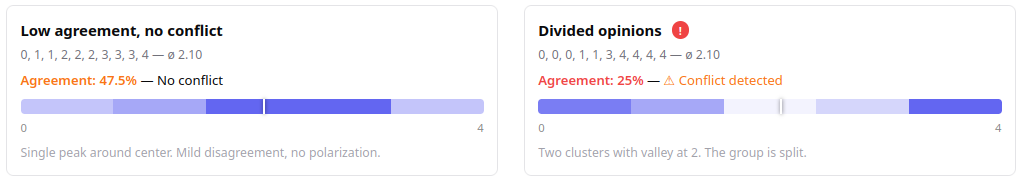
While a low agreement score tells you “people disagree”, the Conflict Detection feature identifies when participants have split into distinct opposing groups.
Example: Scores [0, 0, 0, 1, 3, 4, 4, 4, 4, 4]. Average is 2.3 — moderate. But the heatmap shows two clusters: one group scored it very low, another very high. The average doesn’t represent anyone’s actual opinion.
The system detects conflicts by analyzing score distributions:
- Minimum 6 raters required for detection
- Looks for two or more peaks (vote clusters) in the distribution
- Peaks must be ≥30% of the scale range apart
- There must be a significant valley between peaks (dip <50% of smaller peak)
How is the agreement score calculated?
The agreement score uses standard deviation, normalized to 0–100%:
Agreement = max(0, 1 − 2 × StdDev / MaxScore) × 100%
- StdDev = 0 (everyone same score) → Agreement = 100%
- StdDev = MaxScore / 2 (max spread) → Agreement = 0%
On a 0–4 scale: StdDev ≈ 0.5 → ~75% (excellent), StdDev ≈ 1.2 → ~40% (fair).
How is the conflict detection calculated?
The algorithm analyzes the shape of the score distribution for each criterion, looking for a bimodal (or multi-modal) pattern — two or more clusters of votes with a gap in between. Here is the step-by-step logic:
- Minimum raters check. At least 6 raters are required. With fewer participants, distributions are too sparse for reliable pattern detection.
- Build a histogram. Scores are rounded to the nearest integer and counted into buckets from 0 to MaxScore. For a 0–4 scale, this produces 5 buckets.
- Find peaks. A bucket is a peak if it is a local maximum (greater than or equal to both neighbors, strictly greater than at least one) and contains at least 15% of all votes (minimum 2).
- Check peak distance. Two peaks must be at least 30% of the scale range apart (minimum distance 2). On a 0–4 scale that means ≥ 2 positions apart.
- Validate the valley. Between two qualifying peaks, the lowest point (valley) must satisfy both:
- The valley count is less than 50% of the smaller peak’s count — a real dip, not just a mild slope.
- The depth of the dip (smaller peak − valley) is at least 10% of total votes — the gap is not just noise.
If any pair of peaks passes all checks, the criterion is flagged as having conflicting opinions.
Worked example (0–4 scale, 10 raters): Scores [0, 0, 0, 1, 1, 3, 4, 4, 4, 4]. Histogram: [3, 2, 0, 1, 4]. Peaks at bucket 0 (3 votes) and bucket 4 (4 votes). Distance = 4 ≥ 2 ✓. Valley at bucket 2 = 0 < 50% of 3 = 1.5 ✓. Depth = 3 − 0 = 3 ≥ 10% of 10 = 1 ✓. Result: conflict detected.
Practical tips for facilitators
The agreement badge is shown on the top 5 ranked cards, the ideas you are most likely to act on first. For all other cards, the agreement percentage is available in the tooltip by hovering over the score. The red conflict icon (!) appears on every card regardless of rank, so polarizing ideas are never invisible.
- High agreement + high score: Your winning idea. The team is aligned. Move forward with confidence.
- High agreement + low score: Unanimous thumbs-down. Respect the consensus and deprioritize.
- Low agreement (no conflict): Opinions are scattered. Consider a follow-up discussion to align understanding before re-evaluating.
- Divided opinions (conflict detected): The most actionable signal. Two groups have fundamentally different views. Schedule a dedicated discussion to surface the reasons. Often hidden assumptions or different departmental priorities.
Planning a decision with your team?
Bring it to a 30-minute session with us. We’ll set up the ideas and criteria together in your IdeaClouds account, so when your team rates them, the agreement score and conflict detection work on your data. Faster than figuring it out alone, and you leave with a session ready to run.