Effort vs Benefit Analysis: Prioritization Matrix for Product, Process & Innovation Decisions
Every team faces the same challenge: unlimited ideas, limited resources. Which features should product teams build first? Which process improvements deliver the most value? Which innovation projects deserve investment?
Traditional prioritization methods often fail. Simple voting creates bias—loud voices dominate quiet expertise. Thumbs up/thumbs down misses nuance. Gut decisions lack defensibility when stakeholders question resource allocation.
Effort vs Benefit Analysis provides a systematic, visual framework for prioritization that works across contexts. By plotting ideas on a matrix—effort to implement against potential benefit—teams instantly see which opportunities deserve attention and which waste resources. Diagonal boundaries reveal effort-to-benefit ratios, ensuring decisions account for both dimensions together rather than in isolation.
What is Effort vs Benefit Analysis?
Effort vs Benefit Analysis evaluates initiatives across two critical dimensions:
Effort Axis: Resources required for implementation
- Development time or work hours
- Technical complexity
- Change management needs
- Budget requirements
- Team capacity impact
Benefit Axis: Value delivered by the initiative
- Business impact or cost savings
- User value or quality improvement
- Strategic alignment
- Competitive advantage
- Risk reduction
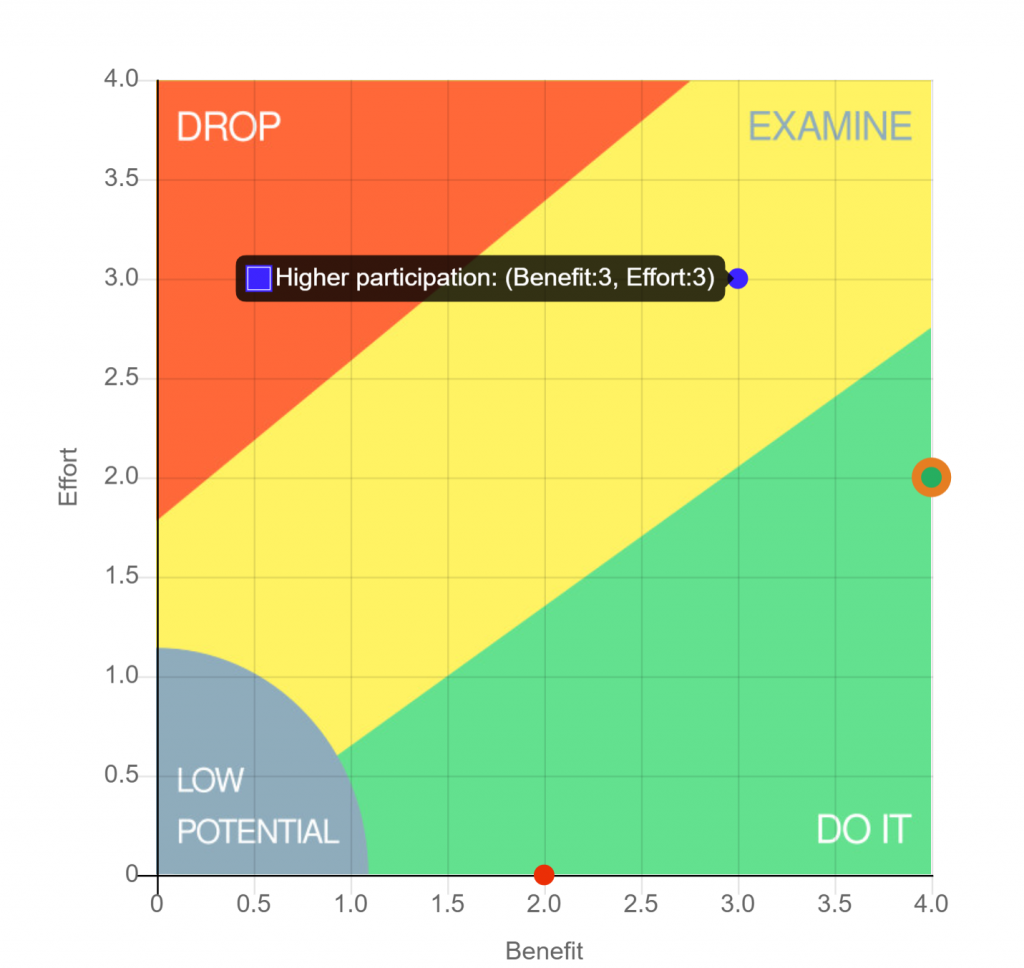
By scoring each idea on both dimensions (typically 0-4 scale), teams plot initiatives on a matrix. Unlike simple 2×2 grids, effective prioritization matrices use diagonal boundaries that balance effort against benefit, creating four distinct action zones:
DO IT (Low-to-Moderate Effort, Moderate-to-High Benefit): Quick Wins—implement immediately. These initiatives deliver strong value relative to the resources required. The diagonal boundary ensures you’re not just looking at "low effort" but at favorable effort-to-benefit ratios.
EXAMINE (Moderate-to-High Effort, Moderate-to-High Benefit): Big Bets requiring strategic decisions. High benefit justifies higher effort, but these need careful planning, resource commitment, and often phased implementation to manage risk.
LOW POTENTIAL (Low-to-Moderate Effort, Low Benefit): Fill-Ins to consider when capacity allows. Easy to implement but limited impact—don’t let these crowd out your DO IT initiatives.
DROP (Moderate-to-High Effort, Low Benefit): Time Wasters to avoid or defer. Poor return on investment regardless of how interesting they might seem.
The diagonal boundaries reveal what simple quadrants miss: an initiative scoring 3 on benefit and 2 on effort (favorable ratio) belongs in DO IT, while one scoring 3 on benefit and 3.5 on effort (marginal ratio) requires examination before commitment.
For Product Teams: Feature Prioritization
Product managers face constant pressure: stakeholder requests, technical debt, user needs, strategic initiatives. Effort vs Benefit Analysis brings clarity.
Benefit in Product Context:
- User value (adoption, engagement, satisfaction)
- Business impact (revenue, retention, market share)
- Strategic fit (roadmap alignment, competitive positioning)
Effort in Product Context:
- Development complexity (frontend, backend, infrastructure)
- Dependencies (APIs, third-party integrations, platform updates)
- Testing requirements (QA, security, performance)
Example: MVP Feature Selection
A SaaS product team evaluates five potential features:
- Advanced Reporting Dashboard – Benefit: 3.5, Effort: 3.2 → EXAMINE (favorable but requires planning)
- Email Notifications – Benefit: 3.8, Effort: 1.5 → DO IT (strong benefit, low effort)
- Dark Mode – Benefit: 1.2, Effort: 1.8 → LOW POTENTIAL (easy but minimal impact)
- Custom Branding – Benefit: 1.0, Effort: 3.5 → DROP (high effort, negligible benefit)
- Mobile App – Benefit: 3.9, Effort: 3.8 → EXAMINE (high value but major commitment)
The matrix makes priorities clear: DO IT Email Notifications immediately. EXAMINE Advanced Reporting and Mobile App—both deliver value but need strategic sequencing and resource planning. Leave Dark Mode in LOW POTENTIAL for spare capacity. DROP Custom Branding despite executive interest—diagonal boundary reveals poor effort-to-benefit ratio.
This connects to flexible criteria decision-making—effort and benefit are YOUR criteria, not a framework’s imposed dimensions.
For Operational Excellence: Process Improvements
Lean and continuous improvement teams use Effort vs Benefit to prioritize process enhancements, quality initiatives, and operational changes.
Benefit in OpEx Context:
- Cost savings (reduced waste, efficiency gains)
- Quality improvement (defect reduction, error prevention)
- Cycle time reduction (faster throughput, shorter lead times)
- Employee satisfaction (reduced frustration, safety improvements)
Effort in OpEx Context:
- Implementation complexity (system changes, workflow redesign)
- Change management (training, communication, adoption)
- Capital investment (equipment, technology, infrastructure)
- Disruption risk (downtime, productivity impact during transition)
Example: Manufacturing Improvement Projects
A production team evaluates improvement ideas:
- Automated Quality Inspection – Benefit: 3.5, Effort: 3.0 → EXAMINE (€50K savings/year justifies €80K investment with business case)
- 5S Workstation Organization – Benefit: 3.2, Effort: 1.2 → DO IT (immediate efficiency gains, minimal cost)
- Breakroom Vending Machine – Benefit: 0.8, Effort: 1.5 → LOW POTENTIAL (employee perk, negligible operational impact)
- Complete ERP Replacement – Benefit: 1.5, Effort: 3.8 → DROP (massive disruption for marginal gains)
The diagonal boundaries make the decision obvious: DO IT 5S implementation immediately for quick wins. EXAMINE Automated Inspection—favorable ROI but needs approval and planning. Keep Vending Machine in LOW POTENTIAL for morale budget. DROP ERP Replacement despite IT advocacy—operators see the effort-to-benefit ratio doesn’t justify the disruption.
For Innovation Teams: Idea Evaluation
Innovation portfolios require balanced risk. Effort vs Benefit helps teams allocate resources across incremental improvements and breakthrough opportunities.
Benefit in Innovation Context:
- Market opportunity (addressable market, revenue potential)
- Competitive advantage (differentiation, defensibility)
- Strategic value (new capabilities, market entry)
- Learning value (technical insights, customer discovery)
Effort in Innovation Context:
- R&D investment (research, prototyping, testing)
- Time to market (development cycles, regulatory approval)
- Technical risk (feasibility, scalability, integration)
- Organizational readiness (capabilities, partnerships, go-to-market)
Example: Innovation Portfolio Review
A corporate innovation team evaluates concepts:
- AI-Powered Customer Service – Benefit: 3.8, Effort: 3.5 → EXAMINE (transformational value, requires ML expertise and phased rollout)
- Self-Service Portal Enhancement – Benefit: 3.5, Effort: 1.8 → DO IT (proven demand, existing infrastructure)
- Chatbot FAQ – Benefit: 1.5, Effort: 2.0 → LOW POTENTIAL (nice-to-have but low differentiation)
- Blockchain Integration – Benefit: 0.9, Effort: 3.7 → DROP (technology seeking problem)
Portfolio balance emerges: DO IT Portal Enhancement to show fast progress. EXAMINE AI Customer Service—high value justifies the investment but needs staged implementation. Keep Chatbot in LOW POTENTIAL. DROP Blockchain despite executive interest—the diagonal boundary exposes poor effort-to-benefit ratio that team consensus confirms.
How to Implement Effort vs Benefit Analysis
Step 1: Define Your Scales as Relative Rankings
Use a 0-4 scale where scores represent relative position within your specific set of initiatives, not fixed thresholds. This ensures scores can be meaningfully aggregated when multiple team members evaluate.
Product Team Example:
- Effort: 0 = least complex initiative in our backlog, 4 = most complex initiative in our backlog
- Benefit: 0 = lowest value initiative we’re considering, 4 = highest value initiative we’re considering
OpEx Team Example:
- Effort: 0 = smallest investment among our options, 4 = largest investment among our options
- Benefit: 0 = least savings/improvement in our portfolio, 4 = most savings/improvement in our portfolio
Relative scales allow you to average multiple evaluators’ scores. Fixed thresholds (“0 = <€5K, 4 = >€100K”) create mathematical problems when aggregating—you can’t meaningfully average threshold categories. See MCDM guide for detailed scaling principles.
Step 2: Use Anonymous Evaluation
Hierarchy bias skews prioritization. Junior engineers won’t contradict senior architects publicly. Operators defer to managers. Anonymous evaluation reveals genuine team assessment:
- Team members score independently
- No discussion before evaluation
- Aggregate results show consensus or disagreement
- Data drives conversation, not politics
Step 3: Interpret the Action Zones
The diagonal boundaries create four zones based on effort-to-benefit ratios:
DO IT Zone: Favorable ratios justify immediate action. An initiative with benefit 3.0 and effort 1.5 lands here—implement without debate.
EXAMINE Zone: Higher effort balanced by higher benefit. Strategic decisions required:
- Do we have resources for this investment?
- Can we phase implementation to manage risk?
- What’s the sequencing relative to other EXAMINE initiatives?
LOW POTENTIAL Zone: Easy to implement but minimal impact. Consider when capacity allows, but don’t let these crowd out DO IT initiatives.
DROP Zone: Poor effort-to-benefit ratio regardless of how interesting. Reject or defer. If someone insists, ask them to justify why the matrix shows unfavorable positioning.
Step 4: Watch for Disagreement
When individual scores diverge significantly, investigate:
- Do some team members see hidden implementation complexity?
- Does one group understand benefits others miss?
- Are there unstated assumptions creating misalignment?
Disagreement is valuable data—surface it, discuss it, resolve it before proceeding.
Effort vs Benefit Analysis vs Other Methods
vs RICE Framework (Reach x Impact x Confidence / Effort):
- RICE forces product-specific dimensions
- Effort/Benefit adapts to any context (product, operations, innovation)
- Use RICE when you need reach/confidence quantification
- Use Effort/Benefit for broader applicability
vs Weighted Scoring Models:
- Weighted scoring evaluates multiple criteria
- Effort/Benefit simplifies to two critical dimensions
- Use weighted scoring for complex trade-offs across many factors
- Use Effort/Benefit when effort and value are the primary concerns
vs ICE (Impact x Confidence x Ease):
- ICE and Effort/Benefit are similar (ease = inverse of effort)
- Effort/Benefit’s visual matrix makes patterns clearer
- Use ICE for numerical ranking
- Use Effort/Benefit for visual portfolio view
When Effort/Benefit is the Right Choice:
- Limited time for prioritization decisions
- Need stakeholder alignment across diverse perspectives
- Visual communication important (executives, cross-functional teams)
- Decisions driven primarily by ROI considerations
Apply Effort vs Benefit Analysis to Your Decisions
Effort vs Benefit is one of many prioritization approaches. The right method depends on your context—team size, decision complexity, and what trade-offs matter most. Explore how different teams adapt prioritization criteria to their specific needs, from product roadmaps to operational improvements to innovation portfolios.