Enhancing team decision-making: Exploring IdeaClouds' ranking techniques
Surely you are familiar with these situations: Intense discussions in meetings where different approaches to a solution are put on the table. In the end, a decision is made that seems acceptable to the majority at first glance, but leaves a feeling of dissatisfaction in the team.
What is the reason for this? Why do seemingly majority-based decisions not always seem to be the best choice? And most importantly, is there a way to overcome this dissatisfaction and truly make better decisions? Welcome to the world of ranking techniques – an innovative approach that will take your team decisions to a new level!
The four ranking techniques
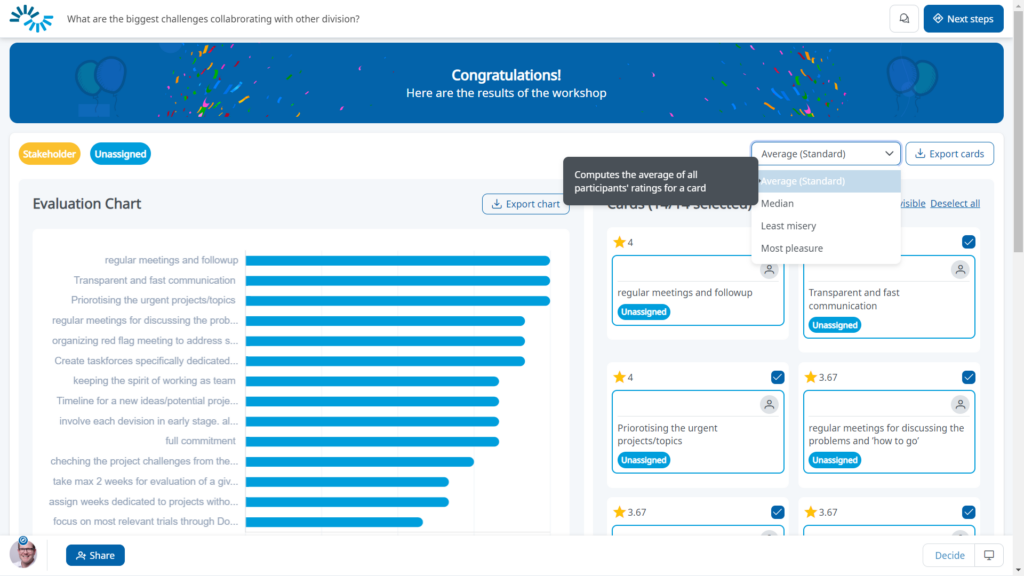
In the realm of decision-making and idea prioritization, the utilization of effective ranking techniques is crucial to ensure informed choices and optimal outcomes. Among the various methodologies available, four distinct approaches stand out: Average, Median, Least Misery, and Most Pleasure.
These techniques serve as valuable tools for organizations and groups seeking to make sense of preferences, mitigate biases, and ultimately arrive at decisions that reflect the collective sentiment. Each method offers a unique perspective on idea evaluation, allowing decision-makers to tailor their approach to the specific circumstances and priorities at hand.
In this discussion, we will delve into the intricacies of these four ranking techniques exploring their strengths and applications in facilitating well-informed decision-making processes.
1. Average
The Average ranking technique calculates the mean score of all participants’ preferences for a given set of ideas. This approach offers a balanced view of the collective sentiment, ensuring that the final ranking is influenced by the entire group. Organizations benefit from this technique as it provides a comprehensive and well-rounded assessment approach to decision-making, particularly suitable for large groups where outliers play a minimal role.
Example:
Consider a team of five project managers (PM) tasked with selecting a new project management tool (tool) from a list of four options. Each project manager rates the tools on a scale of 0 to 4 based on their preferences. The Average ranking technique would involve calculating the mean score for each tool by summing up all the ratings and dividing by the number of participants.
| PM 1 | PM 2 | PM 3 | PM 4 | PM 5 | Average | |
| Tool A | 3 | 1 | 4 | 0 | 2 | 2 |
| Tool B | 2 | 1 | 3 | 1 | 0 | 1,4 |
| Tool C | 4 | 0 | 2 | 2 | 1 | 1,8 |
| Tool D | 3 | 4 | 1 | 4 | 2 | 2,8 |
In this example, based on the average scores, Tool D has the highest average score of 2.8, making it the top-ranked choice according to the Average ranking technique.
2. Median
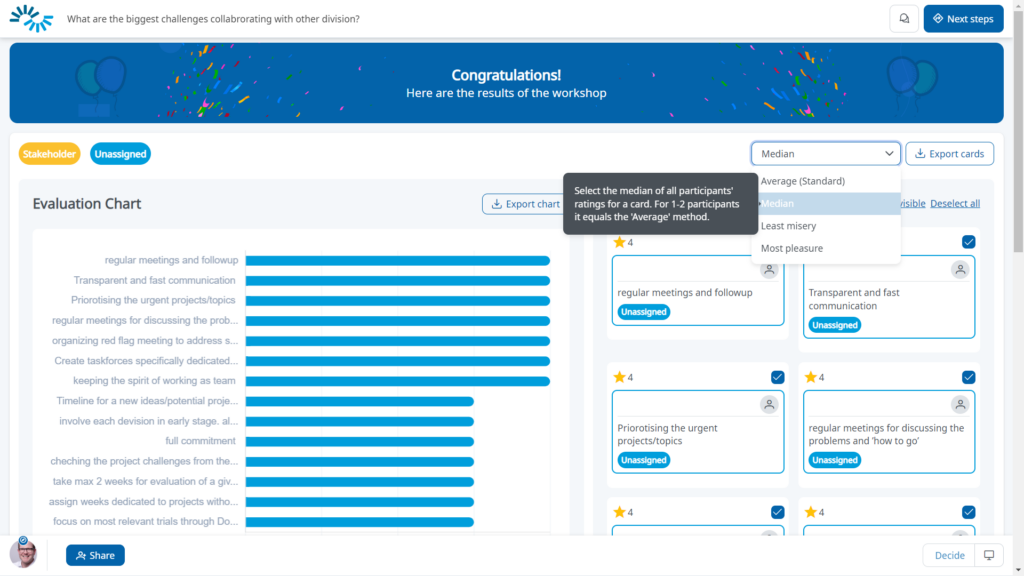
The Median ranking technique considers the central value of preferences within a set of ideas. Unlike the average, the median is less affected by extreme values, making it especially valuable when outliers are present. This robustness ensures a more accurate representation of the central tendency, particularly in scenarios with potential outlier influence. By prioritizing the middle value, organizations can discern ideas with substantial support while mitigating outlier impact.
Example:
Let’s continue with the example of the project managers (PM) selecting a project management tool (tool), but this time using the Median ranking technique. In this approach, the median is determined by arranging the scores in ascending order and selecting the middle value. If there is an even number of scores, the median is the average of the two middle values.
| PM 1 | PM 2 | PM 3 | PM 4 | PM 5 | Median | |
| Tool A | 3 | 1 | 4 | 0 | 2 | 2 |
| Tool B | 2 | 1 | 3 | 1 | 0 | 1 |
| Tool C | 4 | 0 | 2 | 2 | 1 | 2 |
| Tool D | 3 | 4 | 1 | 4 | 2 | 3 |
In this example, the scores for each tool have been arranged in ascending order, and the median score for each tool is determined. Unlike the average, the median is not influenced by extreme values. The median score provides a robust measure of central tendency, especially in cases where there are outliers that could disproportionately influence the results. For instance, in the case of Tool C, which has a lower score from Manager 2, the impact of this outlier is minimized by using the median. When comparing the results to those obtained using the average, notable differences emerge.
Looking at Tool B, for example, its median score is 1, whereas its average score is 1.4. This indicates that the median provides a lower estimate of Tool B’s performance compared to the average. Conversely, Tool C’s median score of 2 exceeds its average score of 1.8, suggesting that the median paints a more favorable picture of Tool C’s performance compared to the average. Similarly, Tool D’s median score of 3 is higher than its average score of 2.8, implying that the median elevates Tool D’s ranking compared to the average.
Furthermore, Tool A’s median and average scores are identical, indicating no difference between the two measures for this tool. Despite these discrepancies, Tool C still emerges as the top-ranked choice according to the Median ranking technique, as it boasts the highest median score of 2. This highlights the importance of considering alternative measures of central tendency, such as the median, especially in scenarios where extreme values or skewed distributions can distort the interpretation of the data.
3. Least Misery
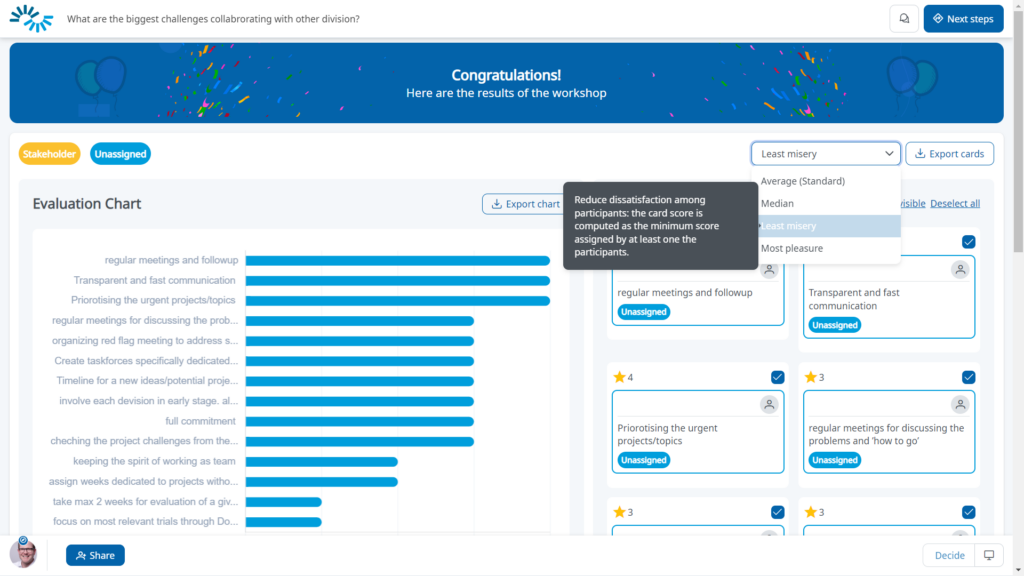
Least Misery, a ranking technique rooted in decision theory, identifies the idea with which the majority of participants are least dissatisfied. This approach prioritizes minimizing discontent, making it a valuable tool in situations where achieving consensus is challenging. It ensures that the selected idea minimizes dissatisfaction across the group.
Example:
Let’s stick with the previous example and delve further into the Least Misery ranking technique (LeastM) in the context of selecting a new project management tool (tool). Each project manager (PM) ranks four proposed tools on a scale from 0 to 4, with 4 indicating the most preferred and 0 indicating the least preferred. The objective is to identify the tool that minimizes dissatisfaction across the team.
| PM 1 | PM 2 | PM 3 | PM 4 | PM 5 | LeastM | |
| Tool A | 3 | 1 | 4 | 0 | 2 | 0 |
| Tool B | 2 | 1 | 3 | 1 | 0 | 0 |
| Tool C | 4 | 0 | 2 | 2 | 1 | 0 |
| Tool D | 3 | 4 | 1 | 4 | 2 | 1 |
In this scenario, team members have ranked the tools, and the Least Misery score represents the lowest score for each tool. According to the Least Misery ranking technique, tool D emerges with the highest (of the lowest) score of 1. However, it’s important to note that while tool D indicates the least dissatisfaction among the options, it doesn’t necessarily make it a top choice. The low score suggests a widespread dissatisfaction with the project management tools overall. Tool D stands out simply because all other ideas with a score of 0 are even worse, indicating a lack of consensus among team members.
4. Most Pleasure
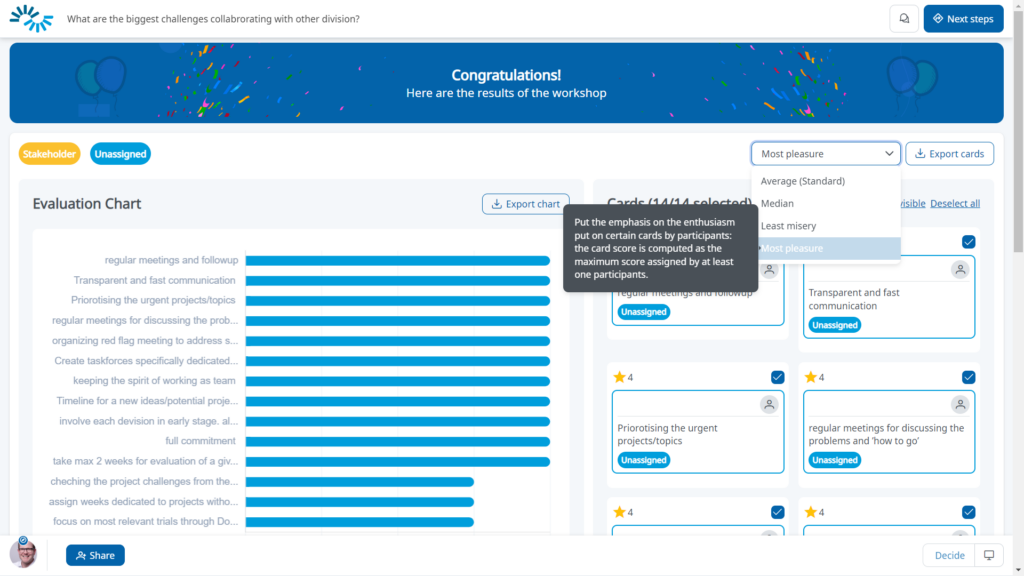
In contrast, the “Most Pleasure” technique only considers the highest rating for each idea. All other ratings will not be considered. Ideas receiving the highest maximum ratings from 0 to 4 are placed at the top of the ranking, while those with the lowest maximum ratings are positioned at the bottom. This shows which ideas the participants are most enthusiastic about.
Example:
Let’s consider the “Most Pleasure” technique again in the context of a team ranking different project management tools (tool). Each project manager (PM) provides a rating from 0 to 4 for each tool, with 4 being the highest rating. The “Most Pleasure” technique (MostP) focuses only on the highest rating given to each tool.
| PM 1 | PM 2 | PM 3 | PM 4 | PM 5 | MostP | |
| Tool A | 3 | 1 | 4 | 0 | 2 | 4 |
| Tool B | 2 | 1 | 3 | 1 | 0 | 3 |
| Tool C | 4 | 0 | 2 | 2 | 1 | 4 |
| Tool D | 3 | 4 | 1 | 4 | 2 | 4 |
In this example, each team member rates the tools, and the Maximum Pleasure Score is determined by selecting the highest rating given to each tools. The tools with the highest maximum ratings are then positioned at the top of the ranking. In this case, Proposal A, C and D have a maximum pleasure score of 4, indicating that it received the highest rating from at least one team member. This technique highlights the ideas that participants are most enthusiastic about based on their highest ratings.
The benefits of using ranking techniques
Problem-solving precision
The versatility of these ranking techniques allows organizations to tackle complex problems with precision. Whether striving for consensus, minimizing discontent, or maximizing enthusiasm, IdeaClouds’ ranking techniques provide a tailored approach to problem-solving that aligns with the specific goals of each decision-making process.
Data-driven decision-making
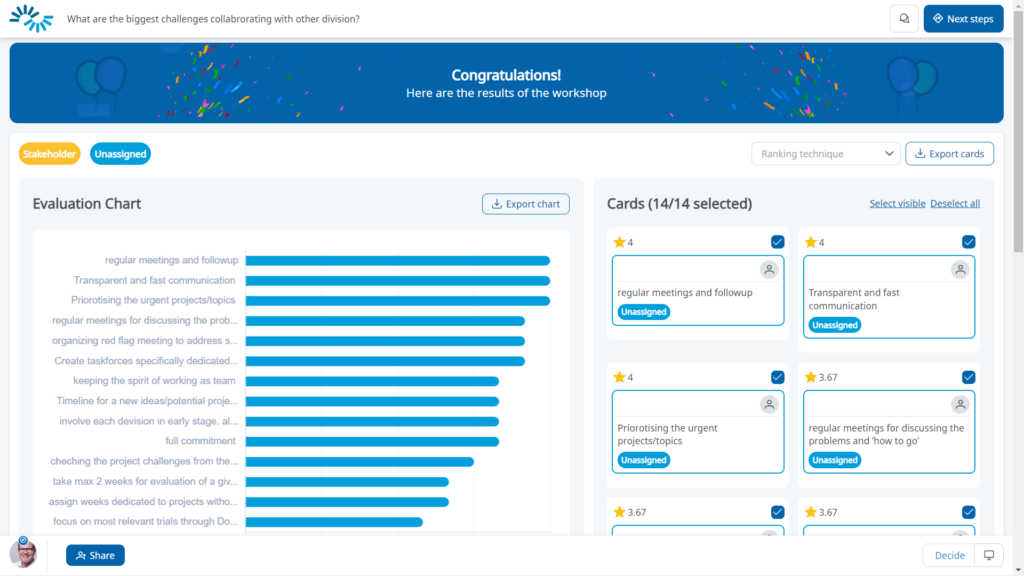
In an era dominated by data, ranking techniques empower organizations to make informed, data-driven decisions. By presenting aggregated results in a clear and understandable format, these techniques facilitate decision-making grounded in the collective insights of teams. Whether utilizing the balanced Average technique, the robust Median technique, which minimizes the influence of outliers, the consensus-driven Least Misery technique, or the Most Pleasure technique, which focuses solely on top ratings, organizations can confidently leverage data to inform their choices.
Examples of using IdeaClouds' ranking techniques in organizations
Product feature prioritization:
When a product development team needs to decide which new features to prioritize for their software, they can use the “Average” ranking technique. Team members rate each proposed feature, and the one with the highest average score becomes the top priority.
Strategic planning:
In strategic planning sessions, leaders can leverage IdeaClouds’ “Median” strategy to evaluate different strategic options. This ranking technique is advantageous because it helps prevent extreme strategic decisions that could have significant and potentially adverse consequences, steering the team away from ineffective or risky paths. By prioritizing the median, the chosen option represents a middle ground that balances diverse viewpoints and preferences among participants, fostering acceptance, and collaborative decision-making.
Conflict resolution in teams:
When a cross-functional team faces conflicts over different approaches to a problem, the “Least Misery” technique can be applied. By identifying the option that causes the least dissatisfaction among team members, organizations can promote consensus and reduce tension.
Innovation ideation:
During an ideation session to generate innovative ideas, the “Most Pleasure” technique can be employed. Ideas that receive at least one maximum rating are highlighted, demonstrating which concepts excite team members the most and warrant further exploration.
Employee engagement initiatives:
When HR teams seek to implement employee engagement initiatives, they can use the “Most Pleasure” technique to identify which proposed activities or benefits resonate most with employees, promoting a positive workplace culture.
IdeaClouds – a beacon for democratic teamwork
IdeaClouds’ ranking techniques are underpinned by well-established methodologies. Preference aggregation, decision theory, and statistical analysis are key elements that ensure the reliability and validity of the results, instilling confidence in the decision-making process.
Ranking techniques are proving to be a powerful tool for companies looking to harness the creative potential of their teams, especially in the context of remote work. Through precision and a diverse array of ranking techniques, it simplifies complex decision-making, encourages engagement, and fosters a culture of inclusivity and innovation. In an era where every decision counts, IdeaClouds is a beacon for democratic teamwork.
